
What can we learn about the stock market from a drawdown chart?
Drawdown is an underused and hard to find metric for understanding stock market behavior.

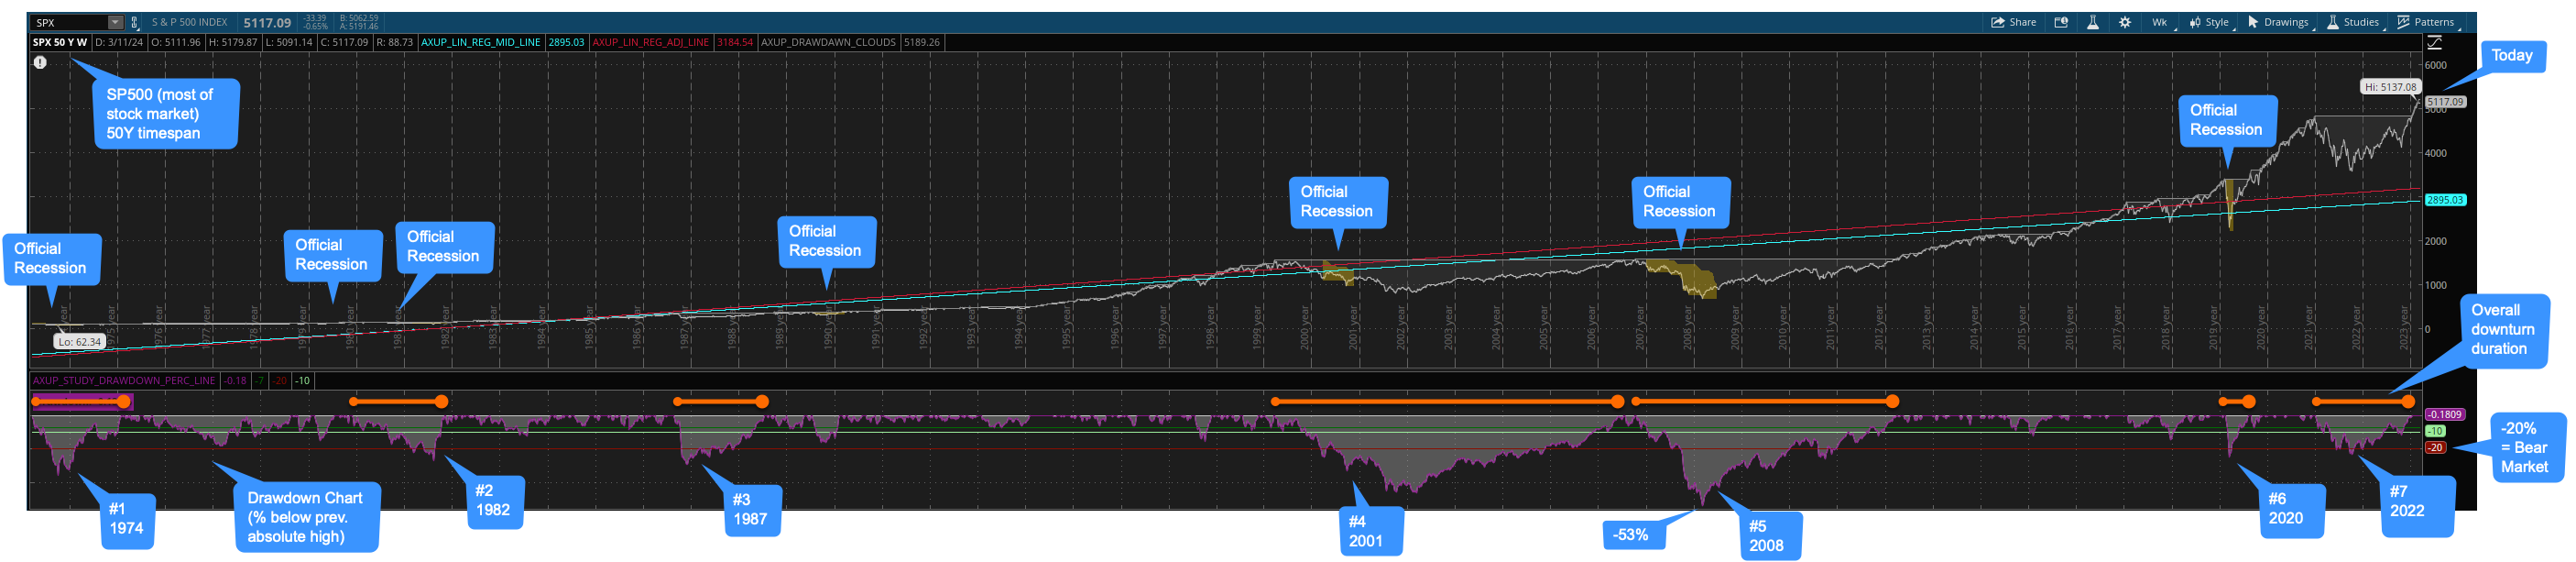
Just take a minute and have a detailed look at the above chart covering the last 50 years of the stock market SP500. You will need to zoom.
The chart on the bottom shows drawdown: the % below the last recorded high point.
What can we learn?
Gauging severity: Drawdown lets us see how severe a market downturn is, whether it becomes a bear market (-20% or more) and how long it lasts until a new high point is set. (See red line on the bottom chart)
Bear markets: There have been 7 bear markets in the last 50 years, resulting in an average of 1 every 7 years, but with quite a bit of variability.
Down-market duration: The duration of the bear market period (when it is lower than -20%) is shorter than the overall time of the “down-market” (when it is below the historical highest point and has not yet reached a new market high). Down-markets are more interesting because they represent the point where any purchases can be sold without a loss. Down-markets in this study period range from around a half a year (#6) to around 7 years (#4).
Up-market duration: “Up-markets” are the time in-between down-markets where new record-highs are being regularly set and the market is gradually moving upwards. These vary in duration from just a few months (e.g. between #4, #5) and over 10 years (e.g. between, #3 #4).
Severity of downturns: The worst drawdown rate was -53% in the 2008 (#5) bear market. That means the stock market lost over half its value, and this was immediately after another 7-yr long downturn where it lost over 40%. However, the stock market regularly loses ~10% of its value (green line). This is really nothing to be worried about, and frequently doesn’t lead to a bear market (red line).
Recessions: As I have written about elsewhere in more detail, “recessions” are highly subjective and are not the best way to analyze investment risk. Downturns and bear markets are more objective. From the chart you will see that some bear markets never had a corresponding recession (e.g. 2022), and some recessions never resulted in a bear market (e.g. 1990). Thus, bear markets are more useful to focus on than recessions. This also has the benefit of removing some of the “recession drama” from the investment equation.
Overall trend: 2000-2012 was a highly volatile period with the deepest downturns in the last 50 years, which also included 2 consecutive bear markets with a longer duration than any others in this sample. The recent downturns related to Covid and related topics in 2020 and 2022 were relatively minor in both duration and severity in comparison. The overall stock market heads progressively up in a “sine wave” of up and down periods. “Bubbles” are a necessary part of the overall upward trend, and just show momentary optimism or excessive greed which will get ironed out by the next downmarket. The periods of 1991-1999 and 2013-2019 probably had lots of people claiming it was a “bubble” and that the “next recession may be coming”, and they were all wrong for a very long time (until they were inevitably right.)
Where we are now: (See top-right on chart) On average the SP500 grows about 10% / yr. Currently we are in an up-market - which hasn’t been going for very long. This happened during a period of the highest interest rates seen in the last 16 years, which many people said would drive us into a recession (which never occurred). Interest rates will eventually go down, which will throw fuel on the fire. Pair this with the fact that a major new technology with basically unlimited use cases (AI) is just in its infancy (both in terms of tech and investment opportunities). You can draw your own conclusions from this. Bubbles are a natural part of the process, and it seems unlikely that we’re at a breaking point yet.
Disclaimer: Your investment decisions are your own, and it is best to test strategies with small amounts of money first, preferably after extensive back-testing. I do not hold any financial degrees or certifications, and I am not a tax advisor.